95% of Expert Committee for the 2020 Dietary Guidelines Had Tie with a Food or Pharmaceutical Company

The vast majority of experts appointed to oversee the science for the current U.S. Dietary Guidelines for Americans had at least one tie with a food or pharmaceutical company, according to a groundbreaking paper published in Public Health Nutrition in 2022. This paper systematically analyzed all conflicts of interest (COI) on the Dietary Guidelines Advisory Committee, a panel of experts appointed every five years to lead the scientific reviews for the guidelines. Currently, the federal agencies in charge of the guidelines, the U.S. Departments of Agriculture and Health and Human Services (USDA-HHS) do not disclose COI on the committee, despite a recommendation by the National Academies of Sciences, Engineering, and Medicine in 2017 to make such disclosures for all financial and non-financial COI.
The paper in Public Health Nutrition found the following:
95% of the members on the expert committee for the 2020 U.S. Dietary Guidelines had conflicts of interest with the food or pharmaceutical industries.
A total of more than 700 conflicts of interest (COI) were found on the 2020 Dietary Guidelines Advisory Committee.
One advisor alone, Sharon Donovan, accounted for 152 of these ties.
More than 50% of committee members were connected to 30 industry actors or more.
The corporations Kellogg, Abbott, Kraft, Mead Johnson, General Mills, and Dannon had the most frequent and durable connections to the committee.
Scroll down for
The full spreadsheet of COI listed by each member’s name
Searchable maps of COI showing names of members and companies
This work was funded in part by The Nutrition Coalition, although we had no involvement in the data collection or analysis portion of this investigation.
The Nutrition Coalition last wrote about conflicts of interest on the Dietary Guidelines Advisory Committee in March, 2019. See this post, which includes some additional conflicts not found in the PHN paper.
Original data in spreadsheet form:
Network maps, in searchable form:
Figures 2 and 4 are legible in the published paper, but Figures 1, 3 and 5 are not. Therefore, we have provided greater clarity for these figures here:
Figure 1:
Instances of COI for each DGAC member over time.
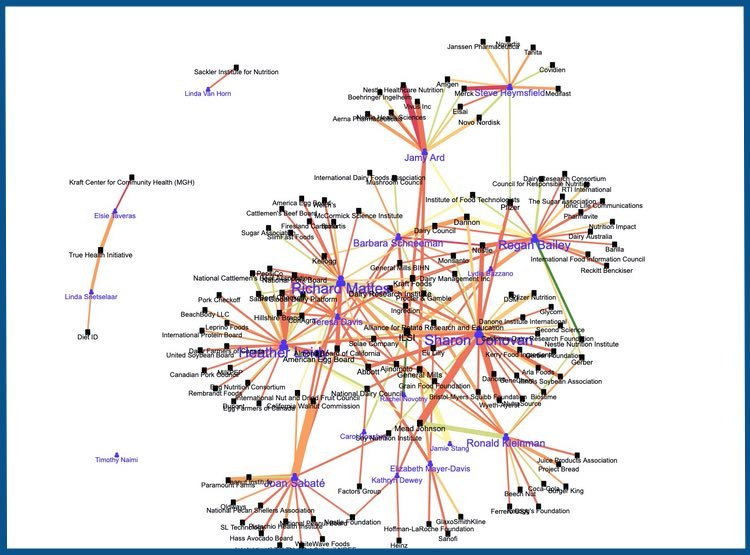
Figure 3:
Combined individual-networks of the 6 DGAC members with the most ties to industry.

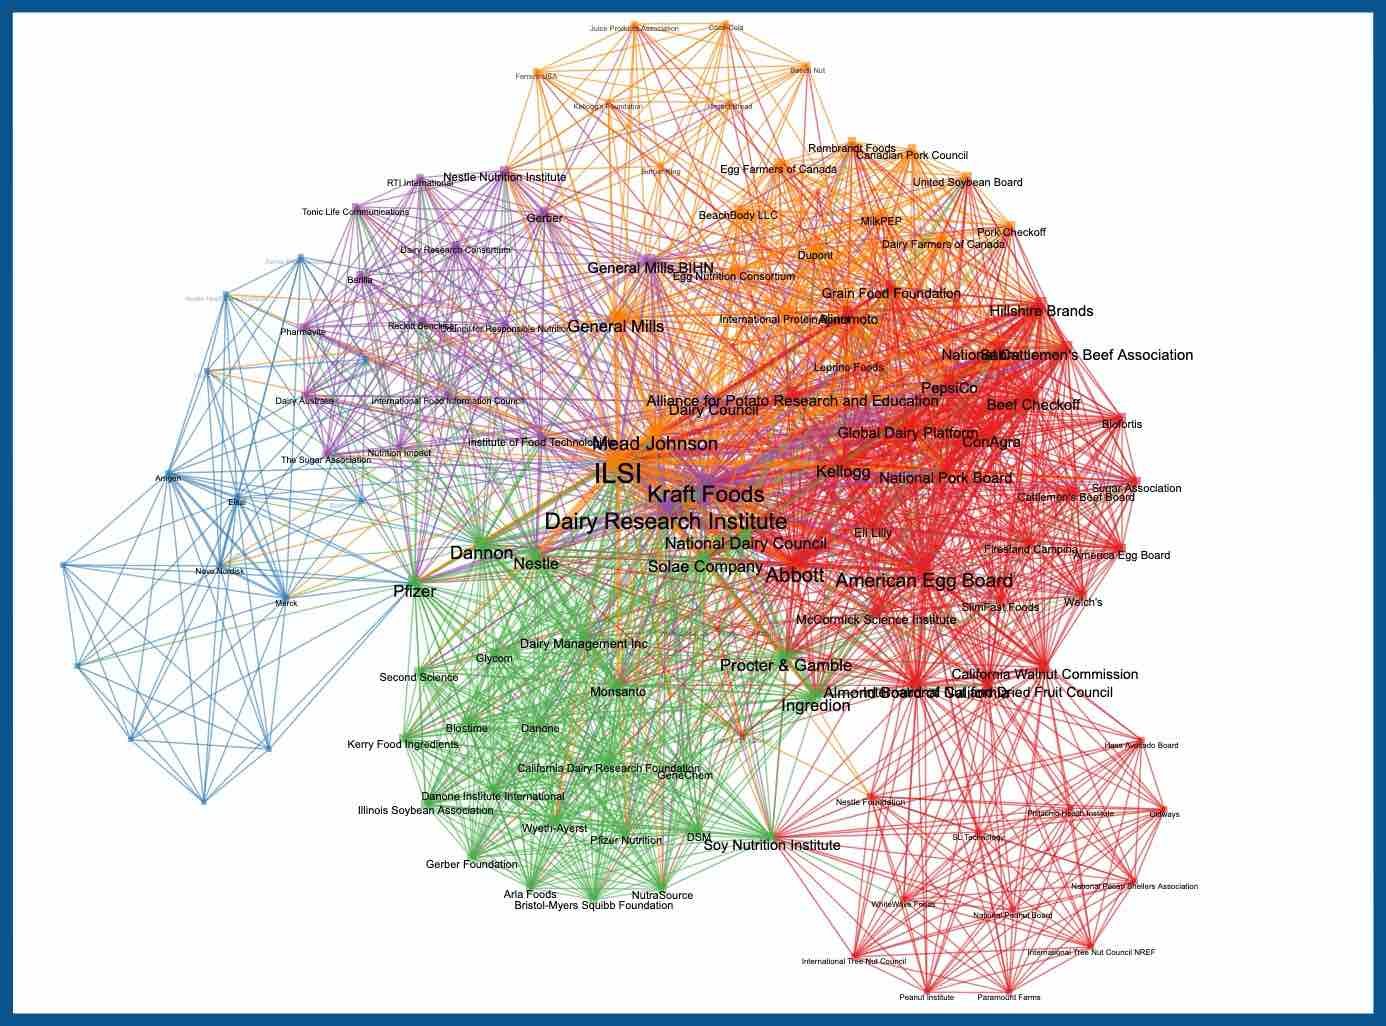
Figure 5:
Ties between corporations that are linked, because they both have ties to the same DGAC member. The greater the number of DGAC members that two corporations have in common, the thicker the line. The implicit assumption here is that having a tie to the same DGAC member makes two companies closer. These ties may not exist explicitly, but by linking them, we might learn something about the structure of corporate networks. We were able to identify “communities” (cohesive subgroups or clusters) that may fall along the lines of industrial sectors. We learn that a corporation's choice to establish a relationship with a DGAC member may in fact, not be random; otherwise the community structure in the network would be absent.